(formerly TS/PP-Draft)
Be Your City's Traffic Superhero!
- Deliver Quality-Assured Traffic Signal Coordination
- Draft Arterial Timings Diagrams
- Perform Travel Time & Delay Studies (with GPS receiver)
|
|
|
(formerly TS/PP-Draft)
Be Your City's Traffic Superhero! |
||
|
||
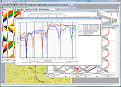
| New! in Version 9.0 | Supports High-Fidelity, Modal Emissions Models! (e.g., CMEM for CO, HC, NOx, CO2, etc.) |
| Color-coded Links on Network View show Actual, Average or Median Link Speed! |
|
|
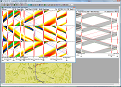
Time-Space or Platoon-Progression diagrams on Intersecting Arteries!
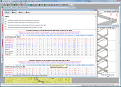
Comparative Travel Time & Delay Reports from GPS Travel Time Runs!
Speed-Distance Plots from GPS Runs!
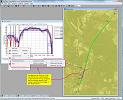
Color-Coded Links on Network View summarize Average Link Speed!
Color-Coded Trip Log Points on Network View show Instantaneous Speed!
Travel Time & Delay Report has split panels to keep the column headers in view while you scroll through the report!
| DEVELOPER | Greg Bullock |
| SUMMARY | Tru-Traffic (formerly TS/PP-Draft) is a worksheet for drafting arterial timings diagrams (time-space, platoon-progression, or time-location). Although Tru-Traffic offers some automatic optimization options, it was developed with the idea that some decisions in signal timing are based on factors that
cannot be quantified easily or accurately for a computer (e.g., driver perception, citizen complaints, queue length, local policies, etc.) and therefore must be made
by a human.
Using Tru-Traffic you can quickly develop either type arterial timing diagram for an artery, a set of intersecting arteries, or a signalized network. You may view the entire diagram or set of diagrams on the screen at once. You can easily adjust any parameter (cycle length, offset, phase sequence, splits, scales, green bands, volumes, etc.) for any intersection as often as desired, and instantly see the effects of the change. Thus, you can quickly optimize the parameters. On time-space and time-location diagrams, it automatically adjusts the green bands to show the traffic flow. On platoon-progression diagrams, it shows the flow density and queue lengths, much like the diagrams of PPD, the TRANSYT-7F post processor (except that the parameters may be changed interactively with the mouse or cursor keys, and the diagrams are displayed on the screen rather than just on the printer). Tru-Traffic allows multiple timing plans and handles signalized networks or intersecting arteries by allowing multiple diagrams, each in its own diagram window, and each representing a different artery. The common intersections are "linked" across diagram windows so that you may edit the parameters in any diagram window, and Tru-Traffic ensures that the common parameters between linked intersections stay concurrent. You may connect a GPS Receiver to your computer and let Tru-Traffic track position and speed. Use an optional remote control device or speech-recognition to control the GPS data collection while driving. The collected information may be used to:
|
| ENVIRONMENT | Requires Microsoft Windows XP, Windows Vista, or Windows 7, 8, and 10, 10MB available memory, and 15MB of disk space. Also, the system must have a printer driver installed, even if it's for just a virtual printer connected to print to a file, not to a real port or on the network. A GPS receiver (either NMEA 0183 compatible, or Garmin Proprietary, or DeLorme Earthmate) is required for tracking position and recording trip logs. See GPS Receiver Recommendations |
| STATUS | Ready to run. Hundreds of current users. |